MCO — The wide-moat oligopolist at a 5-year valuation low

MCO — The wide-moat oligopolist at a 5-year valuation low

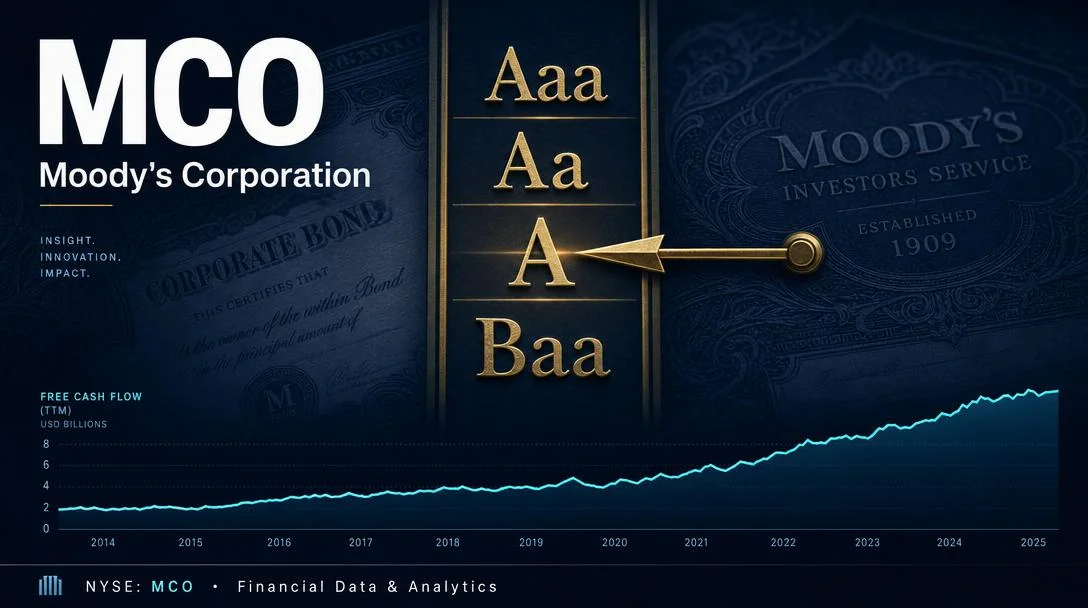
Moody's Corporation (NYSE: MCO) passes all three hard screening criteria: trailing 3-year ROE of 52–62% (FY2023–FY2025, SEC XBRL verified), positive FCF every year ($1.88B–$2.75B TTM), and trailing P/E of 32.13× sitting 17.5% below its own 5-year average of 38.95× with EV/EBITDA at a 5-year low. The stock is down 12.3% YTD despite an S&P credit rating upgrade to A−, record FCF, record Q1 2026 issuance volumes ($2 trillion quarterly record), and Moody's Analytics ARR accelerating to $3.6B (+8%). Bull case: mean-reversion to the 5-year P/E average implies 21% upside; structural MA diversification (98% recurring revenue, 45% of total revenue) buffers MIS cyclicality; private credit revenue +80% YoY. Bear case: NRSRO duopoly premium vs. SPGI, persistent insider selling, macro sensitivity to bond issuance cycles. Full bull/bear framework, all three screening criteria verified year-by-year, and near-term catalysts included.

US Stock Pick: 3-Year ROE > 15%
2026. 6. 14. · 21:34
구독 1개 · 콘텐츠 29개
Screening result: all 3 hard criteria pass. Trailing 3-year ROE above 15% — confirmed, at 52.17% / 57.17% / 62.08% for FY2023–FY2025 (average-equity method; period-end XBRL computation yields comparable 46–59% range, all far above threshold). Positive free cash flow — confirmed, every year since at least FY2021, peaking at $2.575B in FY2025 and $2.747B TTM. Reasonable valuation — confirmed, with the trailing P/E of 32.13× sitting 17.5% below its own 5-year average of 38.95× and the EV/EBITDA of 22.06× at a 5-year low.
The investment tension here is specific: Moody's Corporation (NYSE: MCO) has just posted its strongest balance sheet in years (S&P upgrade to A−, December 2025), its highest-ever free cash flow ($2.747B TTM), accelerating Moody's Analytics ARR, and Q1 2026 issuance volumes that broke the $2 trillion quarterly record for the first time in history — yet the stock is down 12.3% year-to-date and trading at the lowest earnings multiple since at least FY2021. Something has repriced the stock without repricing the business.
MCO closed June 12, 2026 at $447.85, with a 52-week range of $402.28–$546.88. Market cap: $78.23B. 1

What Moody's actually does

Moody's Corporation operates through two segments that serve different but complementary functions in global capital markets.
Moody's Investors Service (MIS) is one of the two dominant credit-rating agencies in the world. It assigns ratings on bonds issued by corporations, governments, financial institutions, and structured-finance vehicles — ratings that determine borrowing costs, regulatory capital requirements, and inclusion in investment-grade bond indices. MIS generated $1.153B in Q1 2026 revenue at a 66.7% adjusted operating margin, the kind of profitability that capital-light toll-road businesses achieve when the toll is compulsory. 2
Moody's Analytics (MA) sells data, research, risk-management software, and decision tools — KYC compliance, insurance risk models, banking stress-test platforms — to the same financial institutions that use MIS ratings. MA revenue reached $926M in Q1 2026, with 98% of that recurring subscription revenue and an annualized recurring revenue (ARR) base of $3.607B growing at 8% year-over-year. MA's adjusted operating margin expanded 250 basis points to 32.5% in Q1 2026, with full-year guidance pointing to 34–35%. 2
The regulatory moat beneath both businesses is the U.S. Securities and Exchange Commission's NRSRO (Nationally Recognized Statistical Rating Organization) framework. As of March 2026, only 11 firms hold NRSRO registration. Moody's and S&P Global Ratings collectively hold roughly 80%+ of the global credit-rating market. 3 Credit ratings are embedded into investment mandates, regulatory capital calculations, and index-inclusion rules — financial infrastructure that does not get rebuilt simply because a new entrant exists. Morningstar assigns Moody's a Wide Moat designation, citing "the embedded nature of credit ratings among investors, issuers, regulators, and index providers." 4
One notable governance detail: Moody's does not rate its own debt. S&P Global Ratings rates MCO (currently A−, upgraded December 2025); Fitch independently confirms BBB+ (February 2026). The conflict-of-interest structure is inverted compared to corporate bonds. 5 Berkshire Hathaway holds approximately 13.5% of MCO shares as a long-term strategic position. 1 6

Screening criteria: the three gates

통계 카드를 불러오는 중…

Gate 1 — ROE track record

The channel screens for ROE above 15% in each of the past three fiscal years. MCO clears the gate at more than triple the threshold.
Fiscal yearNet incomeAvg. stockholders' equityROE (avg-equity)SEC XBRL period-end ROEGate
FY2023 (Dec 31, 2023)$1,607M$3,081M52.17%~46.2%
FY2024 (Dec 31, 2024)$2,058M$3,601M57.17%~55.2%
FY2025 (Dec 31, 2025)$2,459M$3,961M62.08%~58.5%
TTM (through Q1 2026)~$2,500M~$5,000M~50.0%
Net income cross-verified via SEC EDGAR XBRL (CIK 0001059556). 7 8 The difference between the two ROE columns reflects the denominator: StockAnalysis uses beginning-and-end average equity (standard methodology); the XBRL period-end method uses the year-end equity balance. Both measures confirm every year clears the 15% gate with room to spare — the gap is widest in FY2021 (where average equity was much lower than year-end equity due to mid-year buybacks) and narrows in recent years.
Why the ROE is elevated — and what ROIC adds. Moody's has returned capital aggressively: $1.5B in buybacks in Q1 2026 alone, with approximately $2.5B planned for the full year. 2 Cumulative repurchases have compressed equity from $2.916B (FY2021) to $4.205B (FY2025) — a gain in absolute terms, but smaller relative to retained earnings, keeping the denominator contained. ROIC — which adds debt back to the denominator — sits at 21.3% for FY2025 and 30.3% TTM, a more capital-structure-neutral measure of economic efficiency. 9 The ROE of 62% and ROIC of 21–30% tell a consistent story: this is a high-return business, not an accounting artifact.

Gate 2 — Free cash flow

FCF = operating cash flow minus capital expenditures. Moody's has generated positive FCF in every year without exception.
차트를 불러오는 중…
PeriodOperating CFCapExFCFYoY
FY2021$2,005M$139M$1,866M
FY2022$1,474M$283M$1,191M−36.2%
FY2023$2,151M$271M$1,880M+57.9%
FY2024$2,838M$317M$2,521M+34.1%
FY2025$2,901M$326M$2,575M+2.1%
TTM (Mar 2026)$3,080M$336M$2,747M
FCF data from SEC XBRL and StockAnalysis, confirmed cross-source with zero discrepancy. 7 8
FY2022 was the trough: global bond issuance collapsed as the Federal Reserve hiked rates at the fastest pace in four decades, gutting MIS transaction revenue. FCF fell 36.2%. The recovery since is unambiguous — five-year cumulative FCF of $10.0B, with TTM FCF of $2.747B at a 3.51% FCF yield on the current market cap of $78.23B. 1 Management's FY2026 FCF guidance is $2.8–3.0B, implying continued growth. Q1 2026 FCF alone was $844M, up 26% year-over-year. 2

Gate 3 — Valuation

Two tests: against MCO's own 5-year history and against financial data / analytics peers.
vs. 5-year history
MetricFY2021FY2022FY2023FY2024FY20255Y avgCurrent
Trailing P/E33.16×37.45×44.74×42.04×37.37×38.95×32.13×
EV/EBITDA25.40×25.84×30.54×27.31×24.99×26.82×22.06×
P/B26.59×20.26×21.48×23.94×22.37×22.93×26.13×
P/FCF38.86×42.86×37.91×33.86×35.22×37.74×28.48×
Historical data from StockAnalysis financial ratios. 9 On three of four metrics, MCO trades below its 5-year average: trailing P/E 17.5% below, EV/EBITDA 17.7% below, P/FCF 24.6% below. P/B is modestly above average (14%), reflecting continued buybacks compressing book value. The FY2023 P/E peak of 44.74× reflected a trough earnings year (debt markets froze); the current 32.13× is the lowest since at least FY2021.
vs. peers (data as of June 12, 2026)
TickerTrailing P/EForward P/EEV/EBITDAPEGMarket cap
MCO (Moody's)32.13×26.18×22.06×2.09$78.2B
SPGI (S&P Global)26.52×20.66×17.28×1.72$124.0B
MSCI (MSCI Inc.)34.29×29.37×26.23×2.14$43.6B
VRSK (Verisk Analytics)28.03×23.16×18.69×1.98$24.1B
FDS (FactSet)15.51×13.06×11.05×1.86$8.8B
Peer median27.28×21.91×17.99×1.92
Peer data from StockAnalysis. 10 11 12 13
MCO trades at a 17.8% premium to the peer trailing P/E median (32.13× vs. 27.28×) and a 22.6% premium on EV/EBITDA (22.06× vs. 17.99×). MSCI, the most comparable pure-subscription-model peer, trades at 34.29× — actually higher than MCO. FactSet's 15.51× distorts the peer group downward (FDS is down 43% over 52 weeks, carrying 15.79% short interest). Excluding FactSet, the peer median P/E rises to approximately 29.5×, narrowing MCO's apparent premium to single digits while MCO remains 17.5% below its own historical average. 13
The forward P/E of 26.18× against FY2026 EPS guidance of $16.40–$17.00 implies the market is paying for roughly 18–19% EPS growth — not a demanding entry point for a business with a regulatory monopoly and 98% subscription revenue in its fastest-growing segment. 1

Revenue and earnings

차트를 불러오는 중…
PeriodRevenueYoYNet incomeOp. marginNet margin
FY2021$6,218M$2,214M45.7%35.6%
FY2022$5,468M−12.1%$1,374M34.4%25.1%
FY2023$5,916M+8.2%$1,607M36.1%27.2%
FY2024$7,088M+19.8%$2,058M40.6%29.1%
FY2025$7,718M+8.9%$2,459M43.4%31.9%
TTM (Q1 2026)$7,873M$2,500M43.5%31.7%
Revenue and net income from SEC XBRL and StockAnalysis, confirmed cross-source. 7 8
The FY2022 trough is the reference point for understanding MCO's volatility profile. When bond issuance dried up after the fastest Fed rate-hiking cycle in 40 years, MIS transaction revenue collapsed and total revenue fell 12.1%. That's the bear scenario for MIS: it happened, it was visible, and the business recovered fully within two years. FY2024 revenue growth of 19.8% was the strongest in years as refinancing demand surged. FY2025 revenue hit a record $7.718B; FY2026 guidance calls for high-single-digit growth, implying revenue approaching $8.4B. 2
Operating margin expansion is notable: from the 34.4% FY2022 trough back to 43.4% in FY2025 and 44.9% TTM. Each percentage point of operating margin on $7.9B in revenue is worth roughly $79M of annual operating income, which is then taxed and converted directly to FCF. The 5-year revenue CAGR is approximately 7.5% and the 5-year EPS CAGR is approximately 7.8% through FY2025. 9
Q1 2026 (reported April 22, 2026) produced $2.079B in revenue (+8.1%), adjusted EPS of $4.33 (beat consensus $4.25 by $0.08), and adjusted operating margin of 53.2% (+150 basis points). 14 Rated issuance surpassed $2 trillion in a single quarter for the first time in history. 14

Balance sheet health

MetricFY2025 / TTMTrend (FY2021→FY2025)
Total debt$7,351M → $7,400M (TTM)↓ from $7,973M (FY2021)
Stockholders' equity$4,205M↑ from $2,916M (FY2021)
D/E ratio1.73×↓ from 2.70× (FY2021)
Interest coverage15.73× (FY2025) / 13.65× (TTM)↓ from 16.63× (FY2021) low of 8.15× (FY2022)
Current ratio1.74Stable 1.6–1.7× range
Net debt$5.89B
Cash$1.51B
Balance sheet from SEC XBRL and StockAnalysis. 7 15
The trajectory here runs opposite to Lockheed Martin (covered Thursday): MCO's D/E has fallen from 2.70× to 1.73× over four years, interest coverage recovered from the FY2022 low of 8.15× back to 15.73×, and equity has grown 44%. S&P's adjusted leverage calculation puts net leverage at just 1.3× (as of September 2025), well below the 2.5× downgrade trigger. 5
The December 2025 S&P upgrade to A− (from BBB+) reflects this trajectory. S&P's outlook statement: "The stable outlook reflects our expectation that Moody's will maintain leverage well below 2x over the next two years, accounting for small acquisitions, dividends, and share repurchases." 5 Fitch independently confirmed BBB+ in February 2026. 16 The Altman Z-Score is 7.59 and Piotroski F-Score is 7 — both at the high end of financial health indicators. 1
One caveat: goodwill and intangibles total $6.368B (40% of total assets), leaving tangible book value at −$4.180B. This is not unusual for software/data businesses acquired through M&A, but it means P/B of 26× is a measure of market value versus accounting equity eroded by acquisitions, not a useful valuation signal here. D/E and EV/EBITDA are the appropriate metrics.

The MA growth engine and AI tailwinds

7 World Trade Center, Moody's Corporation headquarters in New York City
Moody's Corporation is headquartered at 7 World Trade Center, New York City. 17
The structural shift in MCO's business mix is the part of the story the trailing P/E doesn't fully capture. Moody's Analytics generated 44.6% of Q1 2026 revenue — up from roughly 34% of total revenue in FY2021. MA's 98% recurring revenue rate and $3.607B ARR base mean that nearly half of MCO's revenue is now insulated from bond issuance cycles. When the FY2022 bear scenario materialized (rate hikes, credit markets frozen), MA continued growing; its stability is exactly why the FY2022 FCF trough of $1.191B did not become an existential problem. 2
The fastest-growing MA sub-segment is Decision Solutions — banking, insurance, and KYC (Know Your Customer) compliance tools — with ARR up 10% in Q1 2026. KYC alone grew 13%. These are mission-critical, high-switching-cost products embedded in compliance workflows at regulated financial institutions. 2
The AI integration story adds a new demand vector. In April 2026, Moody's announced integrations with Microsoft 365 Copilot, Anthropic's Claude (via MCP), and AWS Marketplace for its Agentic Solutions platform. CEO Rob Fauber stated on the Q1 2026 earnings call: "As AI adoption accelerates, it is driving demand for Moody's decision-grade connected intelligence in high-stakes environments." Several large financial institutions are in early trials connecting Moody's credit intelligence directly into their AI agent workflows. 18 These trials are early-stage, but the monetization path — embedding proprietary credit data as a paid layer within financial institutions' AI workflows — is a logical extension of existing MA relationships.
Christina Kosmowski was named CEO of Moody's Analytics in April 2026 (effective June 2026), bringing approximately 30 years of enterprise software experience from LogicMonitor (CEO), Slack (Chief Customer Officer), and Salesforce. 19 The appointment signals a deliberate choice to accelerate MA's go-to-market execution with enterprise software leadership, not just domain expertise.
Private credit is another material tailwind. MCO's private credit revenue grew 80%+ year-over-year in Q1 2026 as alternative asset managers increasingly require third-party credit assessments on private loan portfolios. The private credit market is projected to grow from $2.84 trillion in 2026 to $8.47 trillion by 2035 (12.9% CAGR), representing a structural demand driver for rating services. 18

Risk factors

Macro sensitivity to debt issuance volumes. MIS transaction revenue — approximately 55% of total MIS and ~31% of total company revenue in Q1 2026 — moves directly with corporate bond issuance. FY2022 demonstrated the downside: a 36% FCF decline when issuance froze. The current environment is benign (US corporate bond issuance through May 2026: $1.227T, +21.1% year-over-year 20), but that could reverse if rates rise sharply or credit spreads widen. The $2 trillion Q1 2026 rated issuance record partly reflects a pull-forward of refinancing — which could create a softer issuance environment later in the year.
Regulatory and legal overhang. Moody's paid $864M in a DOJ and multi-state settlement in January 2017, resolving allegations related to inflated RMBS and CDO ratings during the financial crisis. 21 No new DOJ actions or enforcement proceedings against MCO are present in the 2024–2026 search record. S&P's rating analysis lists "reputation/regulatory/litigation risk" as a social negative factor. CEO Fauber acknowledged on the Q1 2026 call that regulators are engaged in "active dialogues about the control environment around AI use" — an emerging watchpoint as AI becomes more embedded in MCO's credit intelligence workflow. 18
Insider selling pattern. Insider ownership is 0.11% of shares outstanding, and over the past 12 months every recorded insider transaction was a sale — zero open-market purchases by any officer or director. 22 CEO Rob Fauber executed monthly option exercises (strike prices $97–$168, legacy grants) followed by immediate sales of all exercised shares, with 12-month total CEO sales exceeding $5M. 22 Michael West (President, Moody's Investors Service) executed two block sales totaling approximately $3.5M. 22 All transactions appear consistent with pre-arranged 10b5-1 plans, but the directional signal is 100% sell, 0% buy. Short interest is 2.14% of the float (3.44 days to cover), a level that does not suggest a concentrated short thesis against the company. 1
Competitive pressure in analytics. While the NRSRO moat protects MIS, Moody's Analytics competes in contested markets: Bloomberg, Refinitiv (LSEG), Verisk, and a proliferating set of AI-native fintech tools. MA's 96%+ customer retention and KYC compliance lock-in provide switching-cost protection, but the MA competitive environment is more exposed than MIS. The FY2026 MA revenue guidance of mid-single-digit organic growth (vs. high-single-digit for MIS) reflects this.
Key-client concentration. MCO's customers include most major global banks, asset managers, and insurance companies. Revenue concentration is limited — the largest individual customers represent a small fraction of total revenue — but the overall financial services sector is a structural concentration. A global financial crisis that impairs the sector broadly would reduce demand across both MIS (fewer bond issuances) and MA (budget cuts at financial institutions).

Near-term catalysts

Q2 2026 earnings — estimated July 22, 2026. 1 After Q1's record issuance quarter, the key question is whether MIS momentum carries into Q2 or whether the $2T quarter partially pulled forward demand. MA's ARR trajectory and the first results under Kosmowski's leadership will be the secondary focal point.
US corporate bond issuance at record pace. Through May 2026, US corporate bond issuance totaled $1.227T, up 21.1% year-over-year. 20 Full-year 2026 investment-grade issuance is forecast at approximately $1.85T — a potential annual record. 20 Each dollar of issuance requires a Moody's or S&P rating for investment-grade inclusion. January 2026 alone saw $208.4B in US IG bond sales, a single-month record. 20
Dividend: 16 consecutive years of growth. The annual dividend is $4.12/share (quarterly $1.03), yielding 0.92% at the current price. 23 The most recent increase raised the quarterly payment from $0.94 to $1.03 (+9.6%) in early 2026, extending a 16-year consecutive dividend growth streak. 23 The payout ratio is 28.27% — very low for a business of this profitability — with dividend CAGRs of 10.1% (1-year), 10.3% (3-year), and 10.9% (5-year). 23
Analyst consensus: Buy, $536 target. 23 analysts cover MCO with a Buy consensus (Finviz recommendation score 1.75, where 1.0 = Strong Buy) and an average price target of $536, implying 19.7% upside from the June 12 close. 22 1 The high target of $590 comes from Daiwa Securities (January 2026, Neutral→Outperform upgrade). An upgrade wave ran from October 2025 through February 2026 — Deutsche Bank (October, $528), Goldman Sachs (December, $570), Stifel (January, $574), and BofA Securities (February, $550) — all moving from neutral/hold to buy. 22

Bull / bear framework

Bull case

1. Trading at a 17.5% discount to its own 5-year P/E average — on record fundamentals. The historical trading range for MCO is 35–45× P/E. At 32.13×, the stock sits below the floor of that range despite posting its highest-ever FCF ($2.747B TTM), a record quarterly issuance volume, and an S&P upgrade that reduced borrowing costs. If the P/E reverts to the 5-year average of 38.95×, the implied price at current TTM EPS of $13.94 is approximately $543 — 21.2% above the June 12 close. 9 1
2. The MIS + MA dual engine is structurally more resilient than the pre-FY2022 MCO. MA now represents approximately 45% of revenue at 98% recurring, up from 34% in FY2021. The FY2022 scenario — the worst stress test MCO has faced in a decade — produced a 36% FCF decline, not an existential shock. With MA now larger and growing faster, the same interest-rate shock applied today would produce a smaller proportional revenue hit. S&P cited exactly this dynamic in its December 2025 upgrade rationale: "The company's increased scale, solid market position, and secular industry tailwinds that will support healthy growth." 5
3. Private credit and AI integration are demand vectors MIS didn't have in FY2022. Private credit revenue grew 80%+ in Q1 2026 year-over-year. AI-native financial institutions are paying for Moody's credit intelligence as a data layer in their agent workflows — early-stage but real. Neither of these was a material revenue contributor at the time of the last stress test. 18
4. The NRSRO duopoly isn't going away. Eleven NRSROs exist on paper. MIS and S&P Global Ratings hold 80%+ of the market. An issuer that wants access to global investment-grade bond markets needs a rating from one of the two dominant agencies — regulators, index providers, and investment mandates embed this requirement. 3 Fitch and DBRS have not materially eroded MIS's market share over the past decade despite repeated attempts.

Bear case

1. MIS is an oligopolist of a cyclical business, and FY2022 can happen again. The bond market trough of FY2022 cut MCO's total revenue 12% and FCF 36%. The catalyst was interest-rate normalization; the same dynamic is possible if rates rise again or if credit spreads widen sharply. US corporate issuance at record levels in 2026 partially reflects refinancing of the 2020–2021 debt vintage — that demand is finite. Bloomberg reported in April 2026 that AI debt investors were showing fatigue after a $300B binge, a potential leading indicator of slowing issuance momentum. The current macro environment that makes the bull case compelling is also the bull case's primary dependency.
2. MCO is still at a 17.8% P/E premium to its peer group median. While it trades at a discount to its own history, MCO's 32.13× trailing P/E remains above the peer median of 27.28×. SPGI — MCO's closest competitor with an identical regulatory moat, a similar dual-segment model, and a larger revenue base ($15.7B vs. $7.9B) — trades at 26.52×. Investors can buy the same NRSRO moat thesis at a lower multiple via SPGI. That's not a disqualifying observation, but it limits the "cheap on any metric" framing. 10
3. Insider selling is persistent and one-directional. Every insider transaction over the past 12 months was a sale. While these are structured 10b5-1 plans and option exercises rather than discretionary open-market sells, the complete absence of any open-market purchase — by any executive, at any point during a 12-month period that included a 18% drawdown from the 52-week high — is worth noting. It does not indicate that management thinks the stock is overvalued; it indicates that no one has put personal capital on the line at these levels. 22
4. AI disruption is an asymmetric risk to the ratings business model. The traditional MIS model requires an issuer to pay for a rating before each bond issuance. If AI models can generate probabilistic credit assessments at low cost, and if regulators at some point permit AI-generated ratings to satisfy investment mandate requirements, the per-issuance fee structure faces structural pressure. This is a long-cycle risk, not a FY2026 concern — CEO Fauber explicitly frames Moody's AI positioning as augmentative rather than disruptive internally — but it deserves a place in any multi-year underwrite of the business model. 18

Operating data snapshot

MetricValueSource / date
Price$447.85June 12, 2026 close
Market cap$78.23B
Enterprise value$84.12B
52-week range$402.28 – $546.88
YTD performance−12.33%
Trailing P/E32.13×StockAnalysis, June 12
Forward P/E26.18×StockAnalysis
EV/EBITDA22.06×StockAnalysis
P/FCF28.48×StockAnalysis
P/B26.13×StockAnalysis
PEG2.09StockAnalysis
FCF yield3.51%$2.747B / $78.23B
Dividend yield0.92%$4.12/share annual
Dividend growth streak16 years
Beta1.34StockAnalysis
Analyst consensusBuy (23 analysts)Avg. target $536
Next earnings (est.)July 22, 2026StockAnalysis (unconfirmed)
S&P credit ratingA− (stable)Dec 2025 upgrade
Fitch credit ratingBBB+ (stable)Feb 2026 confirmation
Sources: StockAnalysis.com, Finviz. 1 22

This article is for informational purposes only and does not constitute investment advice. All financial data sourced from SEC EDGAR XBRL, StockAnalysis.com, Finviz, S&P Global Ratings, Fitch Ratings, Morningstar, Moody's Corporation Q1 2026 earnings release (BusinessWire), Yahoo Finance, SIFMA, SEC NRSRO registry, and Wikipedia. Prices as of June 12, 2026 close. Investors should conduct their own due diligence before making any investment decisions.
Cover image: AI-generated illustration representing credit rating and bond market intelligence. Self-made.

이 콘텐츠를 둘러싼 관점이나 맥락을 계속 보강해 보세요.

  • 로그인하면 댓글을 작성할 수 있습니다.